As we started to see when digging into Longi’s advantage in monocrystalline silicon wafer production, the solar manufacturing industry is highly complex with lots of materials, processes, technology disruptions, and industry players. The advanced technical jargon is sometimes unavoidable, and in case that doesn’t make things hard enough, the majority of the industry players communicate with shareholders in Mandarin! Many investors will sit this one out, reciting the mantra, “invest in what you know.”
If the Money Corner has a mantra, it is “invest in what you know others don’t know.” Most people can see that solar power has massive potential for growth as a clean and cheap energy source. Most people don’t know much about how solar panels are made, what equipment is needed, who makes them, and what goes into them. This arcane knowledge will probably never become mainstream, but the markets will reward companies that prove to be indispensable to the industry and deliver consistent earnings growth over time.
Uncertainty about technological trends and competitive dynamics can be hedged through diversification. I created the TMC China Solar Index to give investors access to an easily replicable basket of leading companies operating in different parts of the solar supply chain, all winners in their respective markets. Subscribers will gain insights into each index component over time, including brief investment overviews, and industry and company developments. You will also receive periodic updates on the performance and valuation metrics of the index.
In addition to the TMC Chinese Solar Index, I have also constructed the TMC China Battery Index, which covers the leading companies in the lithium-ion battery supply chain, and the TMC China Solar/Wind/Battery Index, which gives investors balanced exposure to the leaders in the transition to a 100% sustainable energy future.
For investors who prefer concentration and want to learn about the industry in more detail, I will also flag my highest conviction ideas. As we put together the puzzle pieces and learn more about the industry, I think some clear winners will emerge.
Index Construction
The TMC Indices are benchmarked against the CSI 300, the Chinese counterpart to the S&P 500, designed to replicate the performance of the 300 largest companies listed on the Shanghai and Shenzhen stock exchanges. As with all broad indices, the CSI 300 is weighted by market capitalization, includes all sectors, and does not filter components based on valuation or business quality considerations. The key to constructing a market-beating index is to do the opposite: equal-weight a carefully selected group of securities, filtered for high-quality businesses with defensible competitive moats, attractive growth prospects, reasonable valuation, and aligned management teams.
I aim to insert myself primarily at the fundamental analysis stage while setting basic systematic portfolio management rules for weighting, rebalancing, and additions and subtractions. The TMC China Solar Index and the TMC China Battery Index will consist of 10 stocks each, and the TMC China SWB Index will consist of the two indices plus an additional 5 stocks related to wind, EVs, or other peripheral technologies for a total of 25 positions. To minimize human intervention on the portfolio management side, positions will be equal-weighted and rebalanced once annually. I will consider new positions at the end of each quarter, which must take the place of another position of the same size. I will aim for a portfolio turnover of less than 10%, meaning there will be quarters with no additions or subtractions.
All components must be listed on the Mainland stock exchanges for the sake of consistency. However, top picks do not have to meet this requirement. Top picks will be tracked separately from the indices.
Index Performance
While components will ultimately be selected on forward-looking criteria, one important input is past financial performance and how that translates into stock performance. Past performance of the indices’ initial components, measured by monthly average performance, was as follows:
(Eye-popping) past performance is not a guarantee of future results. Valuation expansion has contributed roughly 30% to 50% to cumulative performance, or about 10% annually. However, this means that the index components on average have recorded 30% to 50% annual earnings growth over the past 5 years, an impressive rate of improvement. The indices will be reset to 100 at the end of June 30, 2022.
Index Components and Valuation
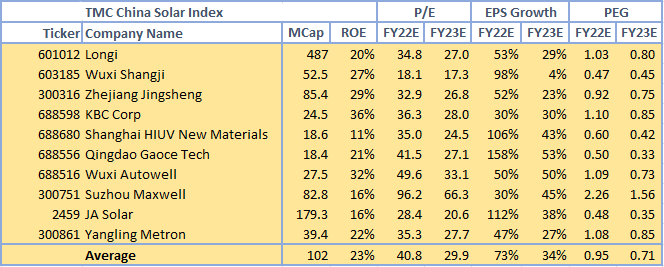
The initial components of the indices are as follows:
Despite a significant expansion in average earnings multiples over the past 5 years, the indices still appear to be reasonably valued in the context of accelerated earnings growth. FY23E multiples look cheap relative to earnings growth. PEG ratios are calculated using FY22E-FY24E average earnings growth estimates, which are likely on the low side given analysts’ tendency to underestimate long-term growth in the renewable space.
I look forward to sharing more with you as I explore this corner of the market. Thanks for reading!


This is top work, Will!